Rectangular Plate Calculator (deflection & stress)
Unlike a disc (circular plate), where stresses and deflections are generally predictable owing to constant edge support, in a sheet (rectangular plate) - where edge supports vary - they are much less predictable.
A sheet may be loaded either with constant or variable pressure over its surface and/or a concentrated (point) force. In either case, the ability of a sheet to survive such loading conditions relies upon its edge supports and material properties.
Supports

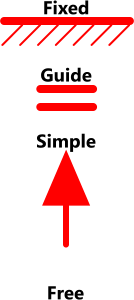
Fig 1. Edge Supports
The edges of a sheet may be supported in an infinite number of ways, including partially. But those available in the sheets calculator are limited to four standard configurations, all of which apply to the entire length of the edge concerned. These four standard edge configurations are; Fixed, Guided, Simple or Free, each of which is shown pictorially in Fig 1 and physically limited as described below:
Fixed: The entire edge of the sheet is fixed in both planar degrees of freedom, linear and rotary; it cannot move in any direction.
Guide: The entire edge of the sheet is free to move in a linear direction normal to the plane of the sheet, but all other movement is prevented.
Simple: The entire edge of the sheet is free to rotate about its support, normal to the plane of the sheet, but all other movement is prevented.
Free: The entire edge of the sheet is free to move in both planar degrees of freedom; linear and rotary.
The SHEETS calculator allows the user to apply any one of the above [four] support methods to any one of the sheet's four edges. The magnitude and location of the sheet's stresses and deflections will vary according to the support configuration selected. In many cases, the highest stresses may not occur at the centre of the longest edge or the centre of the plate, but at its corners.
Calculation Method

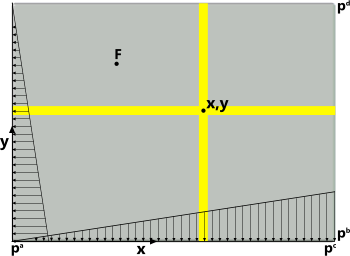
Fig 2. Sheet Loading
The most popular calculation method for determining the effects of loading a sheet is the use of Factor Tables. But these tend to be approximate and limited to individual results based upon an assumed worst-case scenario; e.g. the centre of the sheet or the centre of an edge. Also, the available edge support configurations tend to be limited to those most commonly found in industry, thereby limiting the scope for imagination in design.
One of the best and most recognised sources for calculations of this type is the superb publication 'Formulas for Stress and Strain' in which (Table 26) the stress and deflection are provided only for the centre of the plate and occasionally for the centre of the long edge. However, it is stated in the supporting text for this Table; "There are, however, stresses of similar magnitude near the corners if the corners are held down as has been assumed for all cases presented." It also states that "... the increase in stress at the centre of the plate when the corners are permitted to rise." Owing to these and other comments, such as "stresses may vary considerably (up to 35%) over the plate", CalQlata decided to follow the advice of another well-known publication; 'Theory of Plates and Shells'.
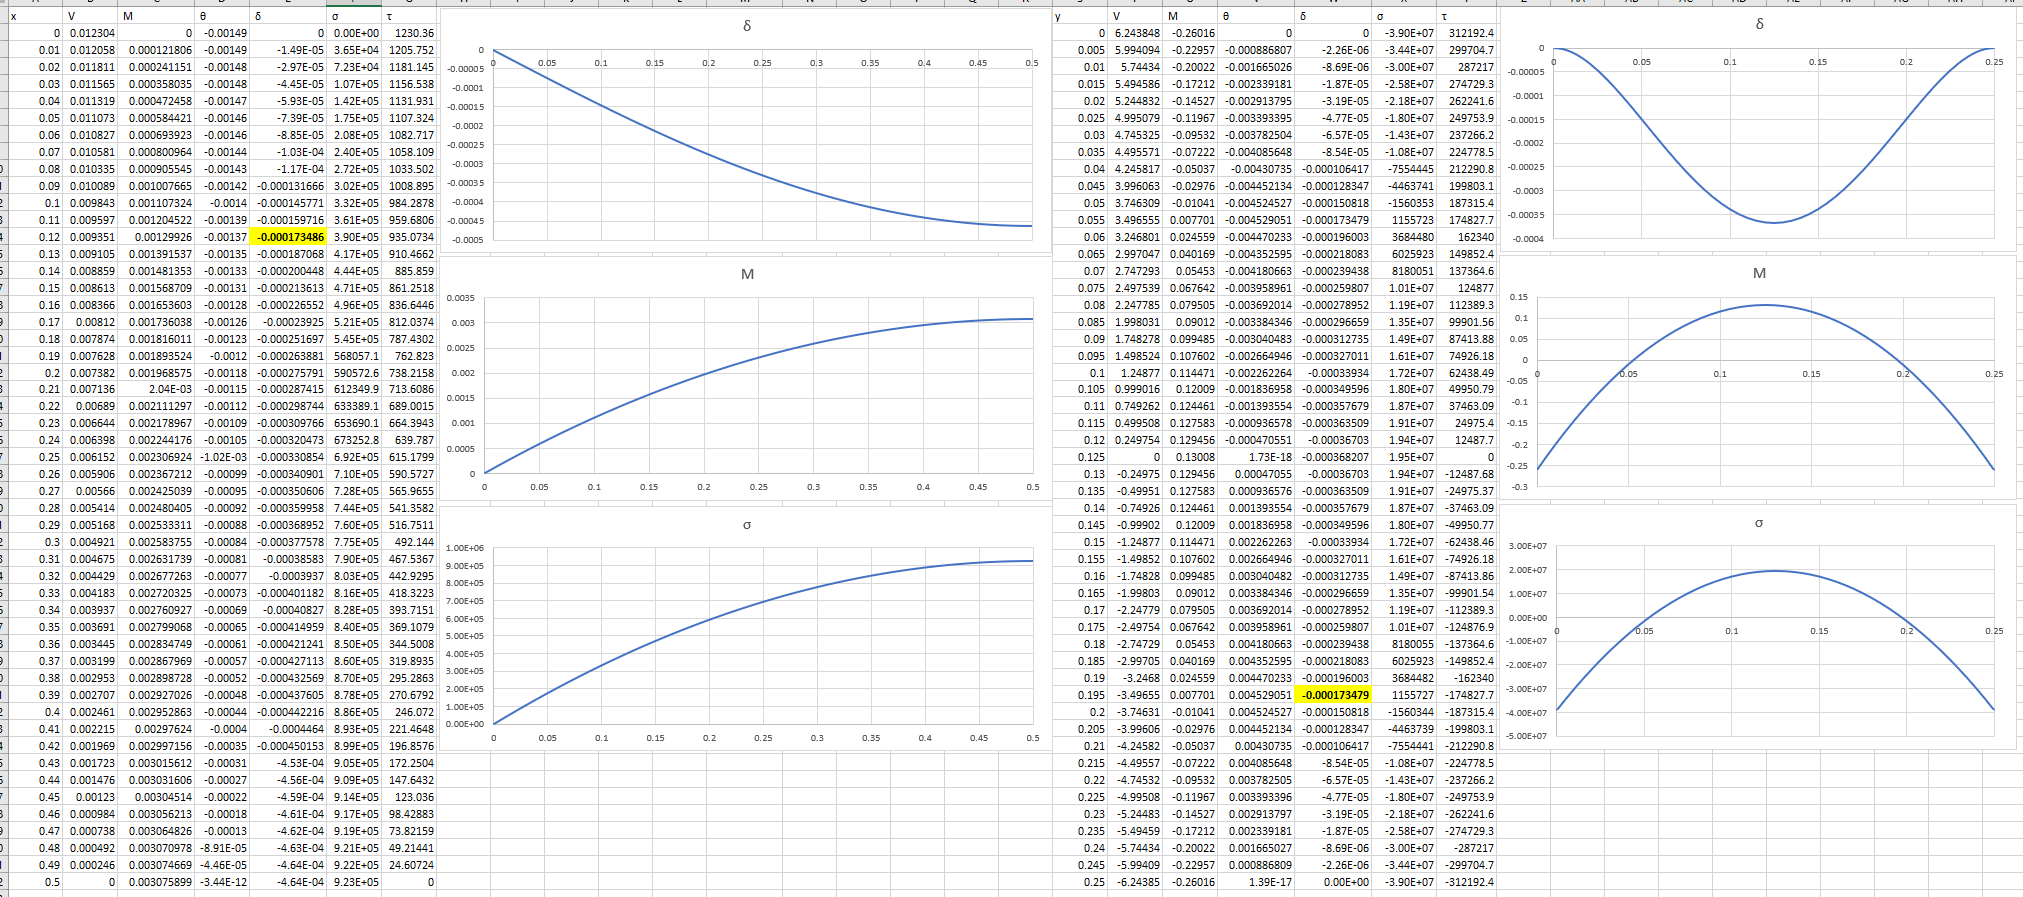
In this calculator, the sheet is divided into strips in both 'x' and 'y' directions (Fig 2); performance is then analysed all along the strips that pass through the entered values for 'x' & 'y'. The load-sharing applied to the x-strip and y-strip are modified to ensure that strip deflections at 'x,y' are identical (Fig 5; 0.000173479).
This technique has revealed that - dependent upon loading conditions and support configuration - a considerably greater (than 35%) discrepancy is possible between the stresses at the centre of a loaded plate and those at its corners (or elsewhere). Moreover, the sheets calculator does not 'hold down' or 'permit to rise' the corners of the plate. In SHEETS, movement of the outer edges is limited exactly as described in Supports above.
The coincident, shear, moment, slope, deflection, tensile stress and shear stress for the combined loading conditions (uniform and concentrated) are provided in both directions at the user's entered location ('x,y'). If desired, this same data may be output at numerous points along both strips (x & y) that coincide at this location, enabling the user to plot these properties in a spreadsheet. The sheet may be divided into between 20 and 1000 [co-ordinate] strips according to the accuracy required.
The user may allocate the longest sheet dimension ('L' or 'ℓ') in either direction; 'x' or 'y'
Loadcases

Fig 3. Incorporating Sheet Mass
Two loadcases are accommodated in SHEETS; variable pressure and concentrated force. If only one loading condition is required, set the other(s) to zero.
In both cases, where neither edge support - in the 'x' or 'y' direction - is Free, the diaphragm tension generated by the applied loads is included in the tensile stress calculations.
Variable Pressure
The variable uniform loading that may be applied to the sheet is described in Fig 2. Whilst the variability is shown in a particular direction (pᵅ to pᶜ & pᵇ to pᵈ), it may be reversed if preferred. In all loadcases, pᵅ, pᵇ, pᶜ and pᵈ are entered as pressures that apply along the edge concerned. If, for example, the user wishes to analyse a vertical plate containing a liquid, the pressure at the top edge (pᵈ) should be set to zero whilst the pressure at the bottom edge (pᵇ) is set to the pressure at that depth ('ℓ'). The pressure at either side (pᵅ & pᶜ) may then be set at the appropriate height ('y').
The mass of the sheet is not included in the calculation. Therefore, if you wish to include it, you must add the following to the applied pressures; 'pᵅ, pᵇ, pᶜ & pᵈ'; p = ρ.t.Cos(θ) (Fig 3)
'ρ' is material density
Concentrated Force
Alternatively, or additionally, a concentrated force may be applied anywhere on the sheet. It is assumed that the contact area of the concentrated force is sufficient to prevent significant bearing stress.
Output
The user may select any location ('x,y') within the sheet for the desired output, which may or may not be the highest or lowest stresses or deflections. It is up to the user to search for the preferred location. However;
The highest deflections are likely to occur ...
... around the centre of the sheet except where Guided or Free edges are present, in which case maximum deflection will occur at or close to the centre of the edge concerned.
... along the [longest] length in sheets of unequal sides.
The highest stresses are likely to occur ...
... at the corners of any sheet except those with Guided or Free edges.
... along the longest edges where Guided or Free edges are present.
Your Opinion
SHEETS does not search for the highest stress or highest deflection for two reasons;
The hesitations encountered when performing millions of calculations can be frustrating.
It is normal to look for output at a particular location, such as a bolt-hole or discontinuity. And given that it is usually obvious where the greatest deflections and stresses are most likely to occur, it is much less frustrating to alter the 'x' or 'y' dimension a couple of times than to put up with the hesitations.
However, we are always open to suggestions, and anyone that purchases this calculator and subsequently suggests a valid change or improvement, will be provided with a free copy of the revised version if implemented.
Sheets - Technical Help
Units
You may use any units you like, but you must be consistent.
Default Data
The default data is deliberately set to unrealistically excessive stresses and deflections simply to exaggerate the effects in plots.
Edges and Supports:
SHEETS has four edges, designated 'a', 'b', 'c' & 'd' and four supports; Fixed, Guided, Simple & Free
All you do is select an edge from the 'Edge' drop-down list, and then select a support from the 'Support' drop-down list. SHEETS will automatically recalculate each time you alter an edge support.
You may enter or alter the properties of the sheet and the position of the desired output, at any time before, after or between edge support changes.
Input Data

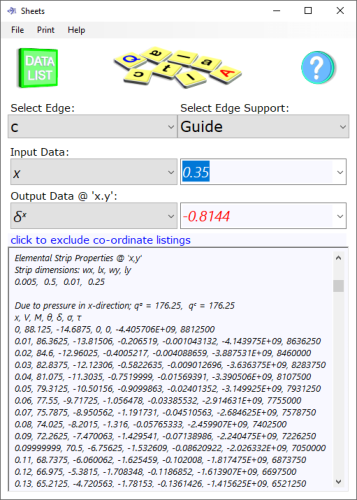
Fig 4. Co-ordinate Plotting Data
x, y: location of the output data
L, ℓ: dimensions of the sheet, either one may be greater than the other
t: thickness of the sheet
pᵅ, pᵇ, pᶜ, pᵈ: pressure at the associated edge
F: magnitude of the concentrated force
xᶠ, yᶠ: location of 'F'
E: Young's (tensile) modulus of the sheet material
ν: Poisson's ratio of the sheet material
N°: number of co-ordinates in the output plot listings
Output Data
@ 'x,y' due to the combined loadcases (p & F). These results always apply to the shortest strip length (L or ℓ):
δ: deflection
V: shear force
M: bending moment
θ: slope
σ: tensile stress; includes induced tension (negative values do not imply compression, they merely reflect moment orientation at 'x,y')
τ: shear stress
Combining the above 'x,y' results:
The resultant forces, moments, slopes and stresses in the 'x' and 'y' directions may be combined in any way you like, but they are normally combined thus:
V, M & θ should be combined using Pythagoras' theorem
σ & τ should be combined using one of the recognised methods; e.g. Mohr's or Von-Mises, St Vennant, etc.
Plot Lists
Plot-data can be listed or excluded as required by the user. When it is included in the output data, it will remain as such until it is excluded by the user. When included, it will appear in the Data List window below the normal output data (Fig 4). This listing will appear in four groups:
Performance due to pressure loading along the strip in the x-direction at 'y'
Performance due to pressure loading along the strip in the y-direction at 'x'
Performance due to concentrated force along the strip in the x-direction at 'y'
Performance due to concentrated force along the strip in the y-direction at 'x'
The properties listed for each group are as follows:
wx, lx: strip width (w) and length (l) in the 'x' direction
wy, ly: strip width (w) and length (l) in the 'y' direction
qᵅ, qᵇ, qᶜ, qᵈ: uniformly distributed load across strip width at edges a, b, c & d
Fy: the share of load applied @ xᶠ, yᶠ in the 'y' strip/direction

Fig 5 shows a typical spreadsheet plot that would be obtained from Sheets co-ordinate listings, for a plate on which a uniform pressure has been applied over its surface. These listings are provided for the strips (yellow bars in Fig 2) at x=0.12 and y=0.195. The edge supports are a mixture of Fixed, Simple and Guided.
Applicability
SHEETS applies to any rectangular sheet (or plate) of homogeneous material, constant thickness and fully supported along each edge with any one of the options described above.
Accuracy
SHEETS' output data is as accurate as the information entered, but accuracy increases with the number of strips analysed. I.e. the greater the value entered for N° (number of strips or co-ordinates), the more accurate the result.
Unlike conventional calculation methods, SHEETS takes into account the relative forces in both directions ('x' and 'y') and will therefore generate different results to those that would normally be obtained using factor Tables. For example, the following Table compares the calculation results from SHEETS with those provided in 'Formulas for Stress and Strain' (FFSS):
FFSS Table number is represented by the character '§' and case number is represented by the symbol '#'
| Plate Ratio | Deflection | Result Ratio | Stress | Result Ratio |
|---|---|---|---|---|
| SHEETS vs (FFSS §26 #1a); pressure = 5000 | ||||
| 1:1 1:1.5 1:2 1:4 |
-0.000921424 (-0.000523664) -0.001538874 (-0.000988357) -0.001734446 (-0.001309160) -0.001835678 (-0.001651193) |
1.759571957 1.557002597 1.324854233 1.111728555 |
29296910 (22453125) 48929040 (37898437) 55147610 (47671875) 58368100 (57890625) |
1.304803229 1.29105692 1.156816467 1.008247881 |
| SHEETS vs (FFSS §26 #1b); force = 50 | ||||
| 1:1 1:1.5 1:2 1:4 |
-0.0003097283 (-0.000239093) -0.0004506565 (-0.000314764) -0.0004804171 (-0.000340617) -0.0004831492 (-0.000349298) |
1.295431892 1.43172597 1.410430081 1.383200562 |
12309840 (39357366) 17911140 (39376643) 19094260 (39382751) 19203600 (39384786) |
0.312770931 0.454867114 0.484838144 0.487589292 |
| SHEETS vs (FFSS §26 #8a); pressure = 5000 | ||||
| 1:1 1:1.5 1:2 1:4 |
-0.000184285 (-0.0001627604) -0.000307775 (-0.0002812925) -0.000346889 (-0.0003267003) -0.000367136 (-0.0003420328) |
1.132245811 1.09414451 1.061796534 1.07339338 |
9765664 (10828125) 16309840 (17109375) 18382910 (19312500) 19457590 (19531250) |
0.901879504 0.953269187 0.95186589 0.996228608 |
| SHEETS vs (FFSS §26 #8b) force = 50 | ||||
| 1:1 1:1.5 1:2 1:4 |
-7.74348E-05 (-0.0001153) -0.000112665 (-0.000144456) -0.000120104 (-0.000148702) -0.000120787 (-0.000149268) |
0.671591467 0.779923865 0.807684158 0.809198559 |
6155137 (48229617) 8955720 (48233061) 9547392 (48233487) 9602495 (48233549) |
0.127621518 0.185675962 0.197941152 0.199083319 |
| Calculation Comparison Plate width: 0.25 and thickness 0.002; E = 2.07E+11; ν = 0.3 |
||||
'Result Ratio' in the above Table is the ratio of results from two calculation methods; SHEETS:FFSS (or SHEETS ÷ FFSS)
The above Table demonstrates the differences between the two calculation techniques; strip and factor. CalQlata has taken the view that the strip (Timoshenko/Woinowsky-Krieger) technique is the more accurate and therefore supports the SHEETS calculator rather than the book.
Further Reading
You will find further reading on this subject in reference publications(4 & 20)

