How Safe Are Speed-Limits?
Responsibilities
The public relies on two service providers to make our lives safer on the road;
Motor Manufacturers are required to protect us in the event of an accident, by way of avoidance and protection, and;
Governments are required to reduce the probability of accidents occurring
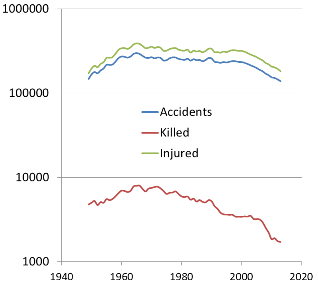
Fig 1. Accident-Injury Trends on UK Roads
Motor Manufacturers
Statistics appear to show that the number of accidents on UK roads has fallen exactly in line with the injury rate (Fig 1)⁽¹⁾; and because injury prevention can only be due to vehicle improvements (see Vehicle Impacts), such a close correlation must also show that the reduction in the number of accidents must be for the same reason; i.e. vehicle improvements (e.g. Brakes and Tyres, suspension, lights, etc.). There appears to be no additional influence on the reduction in the number of accidents.
Motor manufacturers and designers are therefore doing an excellent job.
Governments
Can the same be said of our governments?
Calculation Philosophy
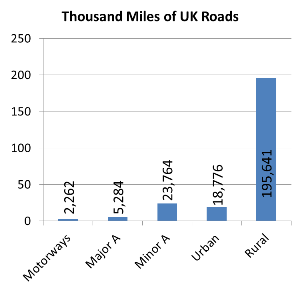
Fig 2. UK Road-Type Lengths
CalQlata has decided to address this issue since completing our assessment of Brakes and Tyres and Vehicle Impacts. Everything we have discovered on this subject, both for and against, even from government sources is simply rhetoric, comment or interpretation. We have found no definitive unbiased mathematical study supporting or refuting speed limits.
We are using a government’s own statistics to support or refute the speed-limit policy without including any independent data because it is difficult to argue against the results of a study in which the data comes from the same organisation that imposes the controlling regulation.
We have chosen the UK because; a) most other countries follow its example when it comes to legal matters and; b) its information is readily available, and; c) we believe (rightly or wrongly) that its information is largely untainted.
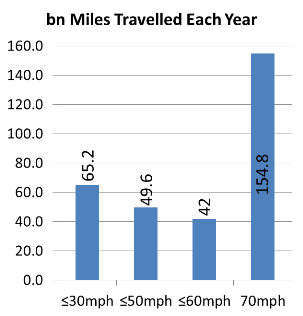
Fig 3. Miles Travelled per Speed Limit
We have tried to make this assessment as short, simple and painless as possible, providing all the calculations, without manipulation or interpretation of the data or the results. This assessment is a factual summary of the UK government’s own statistics on a law it imposes on its taxpayers on the basis of safety.
Whilst the UK has been selected for examination, the following calculations apply to every country that enforces speed limits on its roads.
Road Statistics
UK road miles are as shown in Fig 2⁽²⁾
The following traffic miles were travelled on UK roads in 2014 (% rise from 2013)⁽³⁾
Motorways: ≈65bn (≈2.3%)
Major A-Roads: ≈90bn (≈2.2%)
Minor A-Roads: ≈50bn (≈1.9%)
Urban B-Roads: ≈65bn (≈0.6%)
Rural Roads: ≈42bn (≈3.5%)
Therefore the miles-travelled per available-road-mile are as follows (% of total):
Motorways: 6.52E+10 ÷ 2,262 = 28,817,807 miles travelled/road mile (55.9%)
Major A-Roads: 8.96E+10 ÷ 5,284 = 16,955,279 miles travelled/road mile (32.9%)
Minor A-Roads: 4.96E+10 ÷ 23,764 = 2,087,168 miles travelled/road mile (4.0%)
Urban B-Roads: 6.5E+10 ÷ 18,776 = 3,472,481 miles travelled/road mile (6.7%)
Rural Roads: 4.2E+10 ÷ 195,641 = 214,679 miles travelled/road mile (0.4%)
Making motorways the UK’s most used roads.
The following is an optimised grouping into speed limit zones, which whilst approximate is sufficiently representative for the purposes of this study because of the unavoidable contrast between 30mph and 70mph speed limits and traffic usage (Fig 3). I.e. small changes to the lengths of speed limit will not affect the conclusions:
Motorways & Major A-Roads: 70mph
Minor A-Roads: ≤50mph
Urban B-Roads: ≤30mph
Rural Roads: 60mph
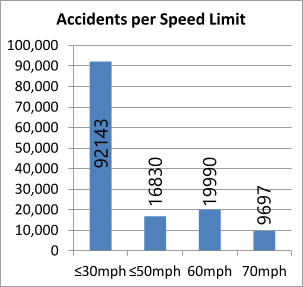
Fig 4. Accidents per Speed Limit Zone
Accident Statistics
The following is a summary of traffic miles per accident for each road type⁽⁴⁾:
70mph: 154.8E+09 ÷ 9,697 = 15,963,700
60mph: 42E+09 ÷ 19,990 = 2,101,051
≤50mph: 49.6E+09 ÷ 16,830 = 2,947,118
≤30mph: 65.2E+09 ÷ 92,143 = 705,425
Making 30mph the UK’s most dangerous roads and 70mph its safest
The unexpectedly high accident rate on 60mph roads (Fig 4) is due to the fact that this road-type/speed-limit zone includes 80% of Britain's roads and comprises the worst built and worst maintained roads in the country⁽⁵⁾.
From Figs 4 & 5, the following statistics can be claimed⁽²⁾⁽⁴⁾:
≤30mph: 92,143 ÷ 18,776 = 4.9075 accidents per mile of road
≤50mph: 16,830 ÷ 23,764 = 0.7082 accidents per mile of road
60mph: 19,990 ÷ 195,641 = 0.1022 accidents per mile of road
70mph: 9,697 ÷ 7,546 = 1.2851 accidents per mile of road
Accidents vs the number of miles travelled per year in each speed limit zone:
≤30mph: 92,143 ÷ 65.2bn = 1,417.6 accidents per billion-miles travelled
≤50mph: 16,830 ÷ 49.6bn = 339.3 accidents per billion-miles travelled
60mph: 19,990 ÷ 42bn = 476.0 accidents per billion-miles travelled
70mph: 9,697 ÷ 154.8bn = 62.6 accidents per billion-miles travelled
Which means the following also holds true:
≤30mph zone is responsible for 61.8% of all accidents/mile-travelled on UK roads
≤50mph zone is responsible for 14.8% of all accidents/mile-travelled on UK roads
60mph zone is responsible for 20.7% of all accidents/mile-travelled on UK roads
70mph zone is responsible for 2.7% of all accidents/mile-travelled on UK roads
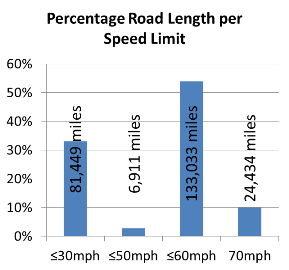
Fig 5. Road Length per Speed Limit
These statistics show that poor road condition and congestion must be responsible for the vast majority of the UK’s road accidents because the highest accident rate (per mile travelled) in the UK occur in the lowest speed zones (61.7% ≤30mph) and on the worst maintained roads (20.8% ≤60mph).
Expenditure
The UK government raised £48.1bn in 2008-2009 from its road users⁽⁶⁾ and yet had allocated only £59bn between 2000 and 2010 for road building⁽⁷⁾, i.e. only 12.5% of income from road user taxation is spent on UK roads; hence the reason for the rapidly increasing traffic density on UK’s roads (Fig 6).
Together with the UK’s speed limits (see Cumulative Braking and Accident Statistics above) the lack of spending must be responsible for congestion and the poor quality of 80% (Fig 2; Rural) of UK roads.
Therefore, the lack of spending and speed limits imposed as they are today must be directly responsible for 82.5% (61.7% + 20.8%) of all UK road accidents.
Synopsis
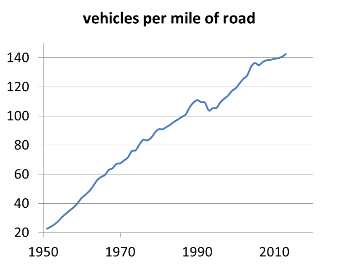
Fig 6. Increasing Traffic Density on UK roads
There is nothing magic about the speed limits imposed by the UK government on its roads. It is clear from Brakes and Tyres and Vehicle Impacts that the consequences of an accident in a modern car bears no relationship whatsoever with the consequences of an accident when each speed limit was originally imposed for reasons of safety⁽⁸⁾
It is also clear from Cumulative Braking that speed control (especially variable speed control) generates congestion and therefore accidents (see above statistics).
90% of UK’s traffic miles are on 70mph roads and responsible for 2.7% of its accidents
6.7% of UK’s traffic miles are on ≤30mph roads and responsible for 61.7% of its accidents
From which it is clear that speed is not the cause of accidents, which is only to be expected because in most cases, accidents can be avoided if the space to do so is available. In order to create this space there must be fewer cars on a section of road at any given point in time and this can only be achieved if car journey times are shorter. Given the lack of road building in the UK, in relation to the number of new cars registered (Fig 6), this means that speeds need to be raised in order to avoid accidents.
No significant reduction in accidents can be attributed to the introduction of the 70mph speed limit⁽⁸⁾. In fact the biggest improvement in the accident rate began at about 2000 Fig 1, when no new speed limits were introduced, but since when we have seen the biggest advances in vehicle design and construction.
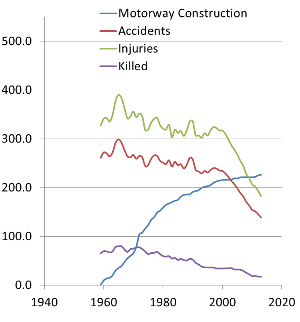
Fig 7. Accident-Injury vs Motorway Building
There is a far more convincing correlation between motorway building and a reduction in accidents (Fig 7) than with the imposition of speed limits.
33% of German autobahns have imposed speed limits, the remainder of which have no speed limits permanent or temporary. 33% of German autobahn accidents occur on sections of autobahn with speed limits and 67% occur on the remaining sections ⁽⁹⁾, confirming that speed limits have no effect on accident rate on German autobahns.
Where speed cameras have been switched off in the UK, speeds have increased slightly but there has never been any increase in accident rate.
The UK government does not publish or collect figures for accidents that occur above any specific speed limit. Therefore we must assume that most of the 2.7% of UK road accidents in 70mph speed-limit zones occurs below the speed limit. Thus; we can also confirm that the fewest accidents (considerably less than 2.7%) on UK roads occur at the highest speeds (>70mph) but command the largest penalties.
Research may show that speed cameras have been directly or indirectly responsible for 28,000 accidents between 2001 and 2014⁽¹⁰⁾. This is approximately 1.2% of all the road accidents during the same period, which whilst may appear small, if the means whereby speed limits are imposed is actually causing accidents, this research appears to support the statistics that speed limits do not reduce accident rates.
The UK government has publicly asked itself the question "Are motorist over-taxed?"⁽⁶⁾, the answer to which should be obvious considering the UK government is making at least 700% profit from the UK motorist (see Expenditure). Properly expended, this profit could remove both the following issues (Space and Road Quality) that together create 82.5% of the UK's road accidents:
Space: The lack of space on its roads causes 61.7% of the UK’s road accidents, yet vehicle density has increased seven times in the UK since the 1950s (Fig 7) and it is difficult to argue the increased lane space case as; a) the authorities do not control middle and outside lane drivers (including lorries), and; b) road widening affects less than 3.1% of UK roads.
Road Quality: At least 80% of UK roads are of poor quality and contribute to 20.8% of the country’s accidents. Road quality improvement is directly proportional to expenditure.
So it is fairly easy to see that 87.5% of the UK's road accidents can be directly attributed to its government’s >700% profit margin.
Given that speeding (imposed in the manner it is today) has nothing to do with safety, the only reason for imposing speed limits must be financial and/or political (improving crime statistics). As such, there can be no justification, on the basis of safety, for applying penalty points to a UK driver’s license for breaking one of its speed limits (he or she may be simply looking for space).
You will of course have noticed that the greatest density of speed cameras is on the safest, fasted roads in the world. The sole purpose of speed restrictions is obviously for financial extortion from the tax-paying motorist.
Conclusion
So, it appears to CalQlata that, unlike the motoring industry, based upon their own figures, the UK government (who is not alone) is not only failing in its responsibilities, it is seriously overcharging its motorists whom it subsequently blames and punishes for its own failure.
Notes
- Reported accidents, vehicles and casualties by severity, road class, built-up and non built-up roads, Great Britain, 2013 (RAS40002)
- Road lengths (miles) (RDL01) {245,728miles} and Map Zone: Ordnance Survey {245,828miles}
- Quarterly Road Traffic Estimates: Great Britain Quarter 3 (July - September) 2014
- Reported accidents and casualties by severity, road type and speed limit, Great Britain, latest available year (RAS40003)
- These roads are too narrow for today’s cars, buses and lorries are allowed to use them, local authorities rarely repair these roads, and don’t grit in winter unless an on-call doctor is resident, hedges and banks are too high to see around corners, etc.
- Are Motorists Overtaxed?
- UK government document SN01448.pdf
- The 30mph speed limit was first made compulsory in the UK in March 1935 . The 70mph speed limit was first made compulsory in the UK in December 1965 (UK government document SN00468.pdf) to limit fuel use during a fuel crisis. It was maintained afterwards because it was claimed to be responsible for a resultant reduction in accidents during its early period of enforcement. This claim does not appear to us (CalQlata) to have been supported by documented evidence.
- Speed Fact Sheet
- Daily Mail: Speed cameras have caused 28,000 accidents in a decade (dailymail news article: 1300830 [6 August 2010])