Mode Shapes Calculator (incl. natural frequency)

Fig 1. Mode Shape Parameter (γ)
It is never a good idea for a member (or beam) to vibrate at its natural frequency. If two connected beams have natural frequencies significantly different to each other, one will dampen any potential excitation in the other. Mode Shapes calculates this condition in your beams.
The 'mode' shape of a beam is the shape of the 'wave' between 'nodes' when vibrating (Fig 2). As long as the beam is vibrating at a frequency that isn't 'natural' the situation will not worsen (excite) with continued exposure to the conditions creating it.
In Mode Shapes, a beam is assumed to be a longitudinal member of constant cross-section, consistent material throughout and supported only at each end.
Mode shape variables (γ and y) for Clamped-Clamped, Clamped-Pinned & Pinned-Pinned end supports have been derived in Mode Shapes from expanding the equation in Fig 1
Stiffness (k or EI)
A beam's stiffness can be calculated by multiplying the Young's modulus of the material by the second moment of area of its section (see CalQlata's Area Moments calculator).
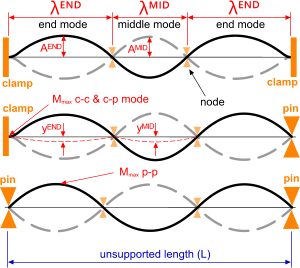
Fig 2. End Conditions (pp-pc-cc)
For any supported (clamped and/or pinned) beam of a given mass per unit length, its inherent stiffness ('EI') will define its static deflection ('y') under gravity. Any externally applied force (per unit length) will amplify this deflection ('A'). Repetition of this applied force will cause the beam to oscillate (Fig 2).
Supports
A Clamped end effectively prevents all rotational and directional movement in the beam at the (fixed) support. This type of support is most likely to allow natural frequency vibrations to become excited and therefore expose the beam to potential damage or reduce fatigue life.
A Pinned end prevents only lateral directional movement in the beam. All other movement (rotational and axial) is permitted (Guide). This type of support is less likely to allow natural frequency excitation to occur.
Natural Frequency
The natural frequency ('ƒⁿ') of a structure is the frequency at which it can maintain its oscillations with minimal continued external input. Its elasticity (stiffness), inertia and gravitational acceleration are together sufficient to provide a large proportion of the energy necessary to keep it going.
If the periodic force initially required to generate the deflection at or close to the natural frequency continues at the same magnitude and frequency ('ƒ'), the amplitude ('A') will increase. The closer 'ƒ' is to 'ƒⁿ', the greater the increase (see Fig 4).
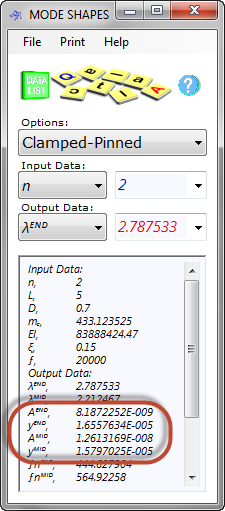
Fig 3. Mode Shape Reduction
Every beam, of any length, has one natural frequency for each wave (mode) it can generate
and
it can only generate an exact number (integer) of waves between its supports
that is, it can generate 1 wave (2 nodes), 2 waves (3 nodes), 3 waves (4 nodes), etc.
but it cannot generate a non-integer number of waves; 1.25, 2.47, 6.1, etc.
Mode Shapes' ƒⁿ refers to the natural frequency (Hz or cycles/second) associated with the end or middle mode generated. Two adjacent modes with different end conditions (see Mode Shapes below) will have different natural frequencies, one of which will help to dampen the other.
The lowest natural frequency is always for a single wavelength (or mode), the next lowest is always for two wavelengths, the next lowest is always for three wavelengths, etc.
Mode Shapes calculates the natural frequency for any wavelength you enter (1-length, ½-length, ⅓-length, ¼-length, ⅕-length, etc.). You must check to see if the associated frequency coincides with your applied frequency; i.e. ƒ/ƒⁿ must be less than ≈0.5 or greater than ≈1.3 for least damage (Fig 4). If this is not the case, then you must either alter the construction of your beam to change its natural frequency or move the supports away from naturally occurring nodes.
If supports coincide with a nodal position, unless you have good reason to do otherwise you should assume that excitation is likely to occur at some time during the life of the beam.
Natural excitation (wind, waves and current) will most probably occur in low mode number (1, 2 or 3) frequencies.
Frequency Inducement
This is the frequency ('ƒ') that is applied (or induced) externally to a structure (or beam). If you apply exactly the same frequency as its natural frequency (for any specific wavelength), you will be asking for trouble. Its deflection, and therefore its stresses, will continue to grow (amplify) until it breaks, or 'sings' which can cause fatigue failure very quickly. Damping ('ξ') in the system, will reduce this amplification (see Damping Ratio below).
Mode shape amplification (static 'y' to dynamic 'A') due to the induced frequency is highlighted in Fig 4
Fatigue life is usually a potential problem for all vibrating structures (see CalQlata's Fatigue calculator). You can use the amplitude ('A') and/or the highest bending moment ('M₁' or 'M₂') for any offending frequency to obtain the maximum expected stress in the beam (using CalQlata's Engineering Principles calculator). Together with the number of vibration cycles expected during its life, you will have generated one of the beam's fatigue stress blocks.
Vortex shedding generates vibration in a beam due to air or water flowing over it at a constant velocity or in regular periodic gusts and can generate excitation if exposure is sufficiently long. There is a special mathematical procedure to evaluate this phenomenon (see CalQlata's Vortex Shedding calculator and CalQlata's Fluid Numbers calculator {Strouhal's number}).
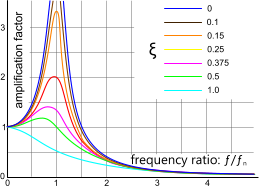
Fig 4. Effect of Damping on Mode Shape
As can be seen from Fig 3 and 4 the input frequency can actually be used to reduce static deflection ('y'). To achieve this you will need to make sure that your induced frequency is significanly higher than your beam's natural frequency ensuring, of course, that it does not co-incide with the natural frequency associated with a different number of modes.
Damping Ratio (ξ)
The damping ratio is the sum of a number of factors (or coefficients) that together represent interference with the vibration process. This damping can come from a number of sources but normally it comprises the sum of the following factors:
Structural: due to imperfections in the material and/or shape of the structure; pipe≈0.005, irregular shape (I-Beam or H-beam)≈0.01
Environmental: due to friction between the moving structure and the surrounding environment; Water≈0.001 Air≈0.00001
End Supports: due to imprecise (moving or soft) end supports; packed soil≈0.01 rigid≈0.0001
Example calculation: for a pipe immersed in water with soil supports at each end the damping ratio will be; ξ = 0.005 + 0.001 + 0.01= 0.016
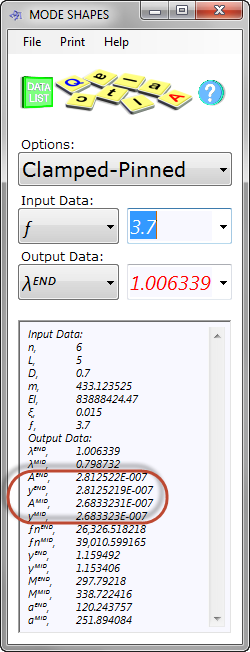
Fig 5. Typical Calculation
Fig 4 shows the relationship between frequency ratio (ƒ/ƒⁿ) and the damping ratio on mode shape (deflection) amplification.
Mode Shapes Calculator - Technical Help
Units
You may use any units you like, but you must be consistent.
Mode Shapes
Mode Shapes calculates the properties of a vibrating beam identifying the number and characteristics of each mode generated. The output data from Mode Shapes may be imported into CalQlata's Vortex Shedding calculator, which will determine the likelihood of environmental conditions exciting the beam's modes.
Any beam can generate any number of wavelengths (see Fig 2), the mode shapes within which may be different. For example:
Clamped-Clamped
Both end nodes of this beam are firmly fixed, i.e. all 6 degrees of freedom are fully constrained.
1-mode; both of its end nodes will be clamped. This is the only possible configuration for any mode in any vibrating beam that has 'clamped-clamped' end nodes.
2-modes; both modes will be clamped-pinned and contains no middle modes.
>2-modes; both end modes will be clamped-pinned and all middle modes will be pinned-pinned (simply supported).
Clamped-Pinned
One end of this beam is firmly fixed, i.e. all 6 degrees of freedom are fully constrained and the other end is pinned (simply supported).
1-mode; one end of this mode will be clamped and the other end will be pinned.
2-modes; one mode will have one end clamped and the other end pinned, and the other mode will have both ends pinned. There are no middle modes in this configuration.
>2-modes; the same as '2-mode' above for both ends. All the middle modes will be pinned-pinned (simply supported).
Pinned-Pinned
Both ends of every mode in this configuration are pinned irrespective of the number of modes.
InPut Data
Mode Shapes calculates the effects of a beam's excitation at your applied frequency (ƒ) and mode number ('n') including its natural frequency (ƒⁿ) and its resultant amplitude magnification (Fig 5; y to A).
The effective mass per unit length (mₑ) Mode Shapes uses to define the mode shape of a beam will always include its actual mass per unit length (m), but you may also add an additional mass per unit length (mₐ) that will represent an externally applied load (i.e. mₑ=m+mₐ). Otherwise the effective mass per unit length is equal to the actual mass per unit length (i.e. mₑ=m)
OutPut Data
Because there are only ever one or two mode types in any vibrating beam, Mode Shapes provides you with the means to calculate both of them at the same time.
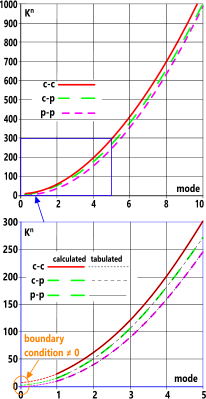
Fig 6. Tabulated vs Best-Fit
Mode Shapes data can be used for calculating stress (from M and λ) directly as a result of an induced frequency (ƒ) or the information can be used (imported) in CalQlata's Vortex Shedding calculator to determine the likelihood of fatigue from detrimental environmental effects.
Applicability
The mode shapes calculator is applicable for any structural element that is not exposed to axial forces (see Mode 14).
Accuracy
Natural frequency calculations are normally based upon discrete tabulated factors (Kⁿ) that follow a relationship with an associated mode number such as that shown in Fig 6. It has been possible to generate a 'best-fit' mathematical relationship that reproduces these curves very closely between modes 1 and 5 (see Table below), however, these curves do not gerate the correct boundary conditions at mode 0 (Kⁿ ≠ 0).
Fig 6 also predicts Kⁿ values for modes between 6 and 10, above which, the p-p relationship prevails for all end conditions. Positions A and B in Fig 7 show the number of modes above which the end condition concerned reverts to a p-p scenario. I.e.
c-p reverts to the p-p factor (Kⁿ) for all modes 8 and above
c-c reverts to the p-p factor (Kⁿ) for all modes 9 and above
In order to correct for the above unrealistic boundary conditions, it has been necessary to modify the above curves to ensure that Kⁿ = 0 when modes = 0
Because Kⁿ represents only part of the c-c, c-p & p-p end condition calculations, the other part of which is the respective solutions according to the relationship shown in Fig 1, the potential error (<10%) is considered (by CalQlata) to be acceptable given the correct boundary conditions predicted by the 'improved-fit' curve. I.e. the naural frequency calculation in Mode Shapes' is more accurate than that predicted by DnV in their Guidelines (No. 14) for free spanning pipelines, 3.7.2 (±30%)
The 'improved-fit' curves for this factor are provided in Fig 7
The tabulated, 'best-fit' and 'improved-fit' values for Kⁿ are provided in the following Table
| mode | tabulated | 'best-fit' | 'improved-fit' | |
|---|---|---|---|---|
| End Condition c-c: |
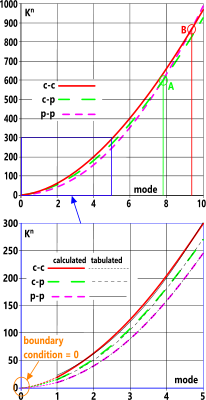 Fig 7. Tabulated vs Improved-Fit |
|||
| 0 | N/A | 7.6 | 0 | |
| 1 | 22.4 | 22.4 | 19.3 | |
| 2 | 61 | 61.7 | 62.9 | |
| 3 | 121 | 120.7 | 125.2 | |
| 4 | 200 | 200.3 | 204.2 | |
| 5 | 299 | 298.7 | 298.5 | |
| End Condition c-p: | ||||
| 0 | N/A | 2.5 | 0 | |
| 1 | 15.4 | 15.36 | 15.4 | |
| 2 | 50 | 50.17 | 52.9 | |
| 3 | 104 | 105.07 | 108.8 | |
| 4 | 178 | 179.18 | 181.6 | |
| 5 | 272 | 271.9 | 270.2 | |
| End Condition p-p: | ||||
| 0 | N/A | 0 | 0 | |
| 1 | 9.87 | 9.87 | 9.87 | |
| 2 | 39.5 | 39.48 | 39.48 | |
| 3 | 88.8 | 88.83 | 88.83 | |
| 4 | 158 | 157.92 | 157.92 | |
| 5 | 247 | 246.75 | 246.75 | |
| Factor Kⁿ | ||||
The mode shapes calculator uses the 'improved-fit' values in its natural frequency calculations.
Further Reading
You will find further reading on this subject in reference publications(2, 3 & 4)

