Copper Alloys (physical properties)
Bronze was probably the first successful metal to be widely exploited by mankind, and because tin and copper ores normally occur together (e.g. Cornwall, England), it is most likely that copper was first smelted with tin impurities by accident, thereby initiating the Bronze Age.
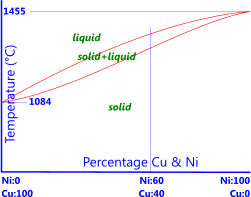
Fig 1. Copper-Nickel Phase Diagram
Pure copper is a relatively soft (pliable) material with good corrosion resistance, excellent electrical conductivity (>100% IACS) and resistant to low-temperature embrittlement.
However, alloying it with other elements will significantly alter its properties making it suitable
for a much wider range of applications, for example; chromium increases its tensile strength without significantly affecting its electrical conductivity making it ideal for electrical wire.
There are many additional elements (e.g. Zinc, Tin, Nickel, Iron, Aluminium, Lead, Berillium, Cadmium, Silver, Manganese, Magnesium, Cobalt, Silicon, Arsenic, etc.⁽¹⁾) that will improve specific properties for particular applications.
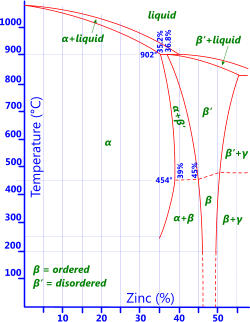
Fig 2. Brass Phase Diagram
The most obvious alloying element for Copper is Nickel, both of which have very similar atomic physical sizes, i.e.; their relative atomic masses are 58.6934 and 63.546 respectively; their densities are within 0.5% of each other, they both have the same crystal structure (Face-Centre-Cubic) and their atomic radii and electron affinity are within 3% of each other, so they fit together physically remarkably well. As such nickel and copper can be mixed together in any relative percentage from 100% copper to 100% nickel (Fig 1). However, they have significantly different heat and electrical properties, e.g.; melting temperatures, specific heat capacities, thermal and electrical conductivities, etc. so each will change the alloy's thermal and electrical properties according to the relative percentages.
Some of the elements that can be successfully alloyed with Copper to alter its properties in specific ways are listed below:
Common Alloying Elements
Nickel: Nickel and copper can be alloyed in any relative percentage (Fig 1) as both metals are totally soluble within each other at any temperature. Copper-nickel alloys with no added impurities are very tough. The absence of any second-phase in the structure (α, β, γ, etc.) eliminates the possibility of electrolytic corrosion making them very corrosion resistant. Nickel-Silvers are Copper-Nickel alloys with relative percentages; 55%<Cu<63%, 10%<Ni<30%, the remaining percentage of which is zinc, are white in colour and normally used for cutlery and keys as they have the highest corrosion resistance of all the copper alloys. Copper alloys containing nickel have the best high-temperature properties.
Zinc: As can be seen from the phase diagram in Fig 2 copper will support limited levels of zinc at any given temperature before the base metal becomes saturated and no longer behaves like an alloy. Copper alloys containing only zinc are usually called brasses.
0% to 15% zinc leaves brasses ductile but difficult to machine
0% to 20% zinc provides similar corrosion resistance to copper but with higher tensile strength
20% to 40% zinc provides less corrosion resistance than copper and the resultant alloys are subject to dezincification and stress-corrosion cracking.
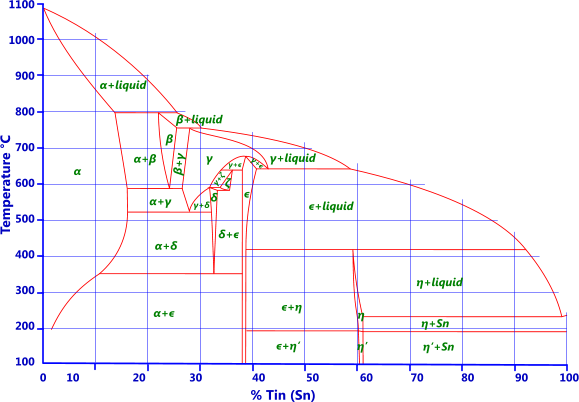
Tin: Tin is added to copper to make traditional bronze (Fig 3). Up to 7% tin may be added to copper for wrought alloys and up to 18% for cast. Because tin normally contains traces of phosphorus these alloys are often called phosphor bronzes (C50500 to C52400) even though there are only trace amounts of phosphor, if any at all, in the alloy. Up to 1% tin is added to brass to improve corrosion resistance (e.g. admiralty and naval brasses). Unlike brass, bronze is not susceptible to stress corrosion cracking. Bronzes with less than 10% tin have excellent elastic properties.
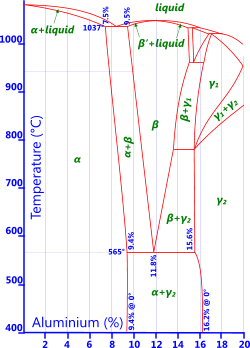
Fig 4. Al-Bronze Phase Diagram
Aluminium: Less than 9.4% aluminium and the alloy will remain ductile (Fig 4). More than this and the alloy will become very hard and brittle if water quenched from above 900°C, but retain very high strength. Aluminium oxide is added to copper to make it very hard indeed. These alloys, normally referred to as aluminium bronze, are characterised by excellent strength and corrosion resistance.
Beryllium: Between 1.75% to 2.5% beryllium (along with 0.5% cobalt) is added to copper in order to allow the base metal to be heat treated (Fig 5). These alloying elements allow the base metal to achieve very high strengths and are normally used for non-sparking tools or springs where its high fatigue resistance can be of considerable benefit.
Chromium: Chromium is added when relatively high strength is required whilst retaining the high electrical conductivity of copper, e.g. in electrical wire (Fig 6).
Lead: Up to 2% lead can be added to any copper alloy in order to improve machinability. However, lead also improves creep and fatigue resistance.
Tellurium: Has a similar effect on copper as lead but you need much less of it to achieve similar levels of creep and fatigue resistance.
Arsenic: Trace amounts of arsenic (<0.05%) is added to Copper-Zinc alloys to improve corrosion resistance and dezincification. This alloying element is usually used in condenser tubes where considerable resistance to corrosion is required.
Silicon: These alloys, normally referred to as silicon bronzes, provide excellent strength and corrosion resistance but they also improve weldability.
Copper Alloys Database – Technical Help
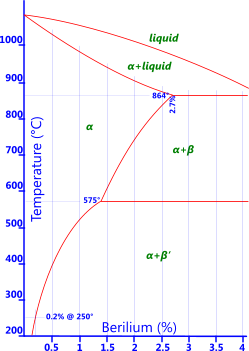
Fig 5. Be-Bronze Phase Diagram
The copper alloys database provides only the physical properties of the various copper alloys, for information concerning their applications visit our Uses web page.
The three principle conditions included in the database are wrought (or forged), heat treated and cast. Heat treated is designated with the initials 'HT'.
Whilst the UNS number is included in the Names, it is also provided as a separate category in order to enable you to sort on this value. The UNS category in the database excludes the preceding character 'C'.
Units
All of the Imperial and metric units can be converted using CalQlata's UniQon conversion calculator.
Missing Data
CalQlata has not been able to find verifiable values for the 'coefficient of temperature coefficient of resistance' for 18 of the alloys and one value for 'yield stress'. The database is otherwise complete.
Accuracy
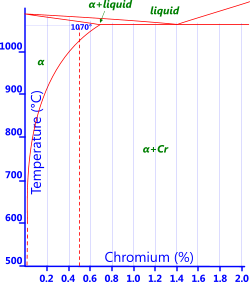
Fig 6. Cr-Bronze Phase Diagram
The information provided in this database is as accurate as that available from the USA and European copper authorities. All calculated data (bulk and rigidity moduli) are as accurate as the Poisson's ratio for the various alloys, which are according to various recognised copper authorities.
Melting temperatures are for the lower limit of the solid+liquid region of the phase diagram(s) and have been interpolated between phase diagrams with more than one principle alloying element. The result from this interpolation have been compared with known values and found to be within 2% of the printed data.
Specific heat and thermal conductivity have also been calculated using known formulas and information and found to be within 4.5% of printed data in which CalQlata has found conflicting information.
CalQlata are therefore confident that, until proven otherwise, that the property data included in this database is between 95.5% and 100% accurate.
Notes
- See CalQlata's Elements and Metals databases for the properties of the base metal and its alloying elements
Further Reading
You will find further reading on this subject in reference publications(2, 3 & 44)

