Metal Fatigue Calculator (structural)
Whilst this calculator is primarily intended as a metal fatigue calculator, the calculations it uses apply equally well to any perfectly elastic material. However, the safety factors and damage ratio's identified in this page cannot necessarilly be applied to non-metals.

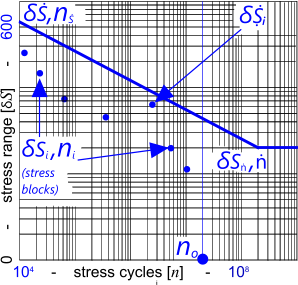
Fig 1. S-N Diagram for Metals
You shouldn't be deterred from attempting metal fatigue calculations simply because it's a procedure with which you are unfamiliar; it's not as complicated as you might think. You simply calculate the limiting design stresses under various operational conditions and then compare the number of these stresses with known performance characteristics for the material, which Fatigue will do for you.
The metal fatigue calculator includes; statistical comparisons of predicted or available stress cycles with base-line or allowable stresses, and assessment according to Goodman's non-zero/mean.
Important: You should only use principal stresses (see CalQlata's Combined Stress) in fatigue calculations, not primary stresses, because principal stresses include the effects of shear.
Of the two statistical calculation methods available in Fatigue ...
1) 'Linear' is generally regarded as most suitable for high-cycle/low-stress (range) applications, and
2) 'Non-Linear' is generally considered most suitable for components with an operational life comprising large stress ranges and large cyclic variations.
... albeit you will find both methods recommended for either condition in various publications.
Before addressing the two calculation methods, it is necessary for you to understand the S-N (Stress-Number) curve:
S-N Curve
An S-N curve is a graphical representation of the relationship between stress-ranges and their maximum permitted number of cycles (Fig 1). Stress ranges and their limiting cycles are normally (but not necessarily) based on a Log10-Log10 relationship. When plotted on a Log10-Log10 graph, the curve is a straight line allowing us to predict mathematically the maximum permissible number of stress cycles for any given stress range.

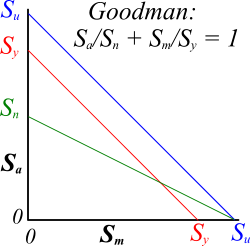
Fig 2. Amplitude vs Mean Stress
Any number (n) that lies on the S-N curve represents the maximum number of stress cycles at the associated stress range (δS) (see Fig 1) above which damage to the material is expected to occur.
Top-Left point of the curve (δṠ,ṅṠ) shows the maximum possible stress range and the bottom right of the curve (δSṅ,ṅ) shows the stress range below which an infinite life is expected.
Stress Blocks
To evaluate the fatigue life of a component or material, you must first generate a number of 'stress-blocks' each of which represents a period in its life. One stress-block represents a number of similar stress ranges in its life and the number of cycles associated with the stress-block represents the number of those stress cycles the component will see during its life. You should select a reasonable number of blocks that best describes the life of the component. It is normal to use up to seven blocks for a component with widely varying stress ranges throughout its life and fewer for components that have a life of narrowly concentrated stress ranges (such as high-speed Shafts).
For example, if you are calculating the fatigue life of a joint in a subsea structure, you first need to decide on the design life of the component (say; 20 years).
Next you acquire a wave spectrum for the region concerned, a simplified version of which is shown in Fig 3

Each range of periods (between the Blue Lines) represents a single stress-block.
Take the average wave period within a stress-block, apply the maximum associated wave height, and calculate the maximum and minimum principal stresses through a single wave cycle. The difference between the two will be your stress range for the stress-block (δSi to δSvii).
Multiply the total number of waves in the block by 20 (for a 20-year design life) and you will have the number of stress cycles (ni) in the stress-block. You can apply the same technique to any component, for example, high-speed shafts or vibration mounts, simply by substituting wave periods and heights with revolutions and amplitudes to establish your stress ranges and cycles.
The Blue dots on the 'S-N Diagram' (Fig 1) show the stress-blocks plotted for the life of a fictitious component. The dot nearest to the Curve (δṨi in the above diagram) represents the most damaging stress-block.
Damage Ratio
The design life of a component is defined by a Damage Ratio: a value between zero and one, where zero represents an infinite life and one describes a component that will fail exactly on the last stress cycle of its design life with no safety margin.
It is reasonable to apply the following values according to inspection capacity and damage consequences:
1.0 for 100% inspection access and no harmful consequences in the event of failure
0.5 for partial inspection access and no harmful consequences in the event of failure
0.3 for 100% inspection access and serious consequences in the event of failure
0.1 for no inspection access and serious consequences in the event of failure
You may interpolate your own acceptable usage factor between the above variations.
Metal Fatigue Calculator - Technical Help
Units
You may use any units you like, but you must be consistent.
How to Perform a Metal Fatigue Calculation:
You're now ready to calculate the fatigue life of a component.
Non-Linear method:
This method compares a user-defined stress-block (δSi) with the most damaging stress-block in the component's life (δṨi) and uses the Weibull parameter (h) and Gamma Function (∏) to allocate a Damage Ratio (η) to δSi.
To find the most damaging stress-block using Fatigue, enter all your stress ranges (δS₁ to δS₇ and associated cycles (n₁ to n₇) in the Linear (Palmgren-Miner) method calculation option (see below) and select the values for the stress block with the highest individual damage ratio (η).
Example (based upon S-N curve (600, 1000) & (60, 1E+08)):
δSi = 130 (user-defined stress-block)
ni = 2000 (expected number of cycles in this stress-block)
δṨi = 200 (most damaging stress-block – closest to S-N curve)
no = 20,000,000 (total number of stress cycles in the design life of the component) (Fig 1)
In this case, the Damage Ratio (η) for the stress-block is 0.043
You then change only δSi & ni for each other user-defined stress-block (δS₁,n₁, δS₂,n₂, δS₃,n₃, etc.) in the life of the component. Finally, you will need to determine η for the most damaging stress-block (see below #) and sum all the resultant Damage Ratios making sure that the total does not exceed your desired limit.

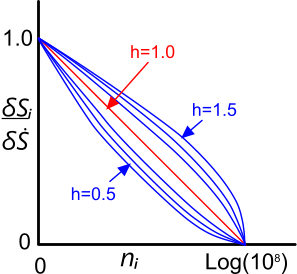
Fig 4. Weibull Parameter
The 'Weibull parameter' and 'Gamma Function' are provided for information only. Fig 4 shows how the Weibull parameter (h) varies with comparative values.
# η (for the most damaging stress-block) = number of cycles in the stress-block ÷ maximum allowable number of cycles for the stress range in this stress-block taken from the S-N curve. If, however, you have used Fatigue to find your most damaging stress-block, you can simply use the damage ratio given by Fatigue.
Linear (Palmgren-Miner) method:
This method compares the number of actual stress cycles in any given stress-block with the maximum number allowed for the associated Stress Range according to the S-N Curve and sums up the Damage Ratios for all the stress-blocks in the life of the component.
Fatigue provides a damage ratio (η) for each stress range (δS₁ to δS₇) in the Data Listing page. If any of the damage ratios is greater than 1.0 the associated stress range will be above the S-N curve. The largest value shows the most damaging stress block.
Example (based upon S-N curve (600, 1000) & (60, 1E+08)):
δS₁ to δS₇ = 236, 195, 123, 89, 65, 61 and 45
n₁ to n₇ = 4, 1000, 10000, 237569, 2259489, 33946565 and 657387558
In this case, the Damage Ratio (η) for the stress-block is 0.43
Giving you a safety margin of 0.57 and a safety factor of 2.3
That's all there is to the Palmgren-Miner linear damage rule (simple but effective!).
A word of caution when using the Linear calculation method: If any of your predicted stress-block cycles are less than ṅṠ in your S-N curve, the damage ratio (η) for those individual stress blocks will be zero (0) contributing nothing to the design life of the material (or component), which may or may not be the case. CalQlata would recommend that should any of your stress blocks have a stress range (δS₁ to δS₇) greater than 50% of the material's yield stress, and its associated cycles (n₁ to n₇) is less than ṅṠ, you should use the Non-Linear calculation method.

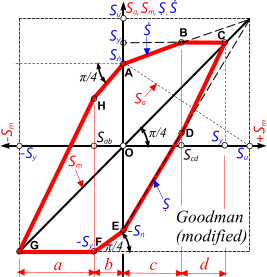
Fig 5. Goodman's Modified Diagram
Non-Zero, Multi-Axial, Mean method:
Goodman developed this method to establish fatigue life without the need for an S-N curve. He developed an hysteresis curve the boundary of which represents the fatigue stress limits. This curve is divided (vertically) into 4 zones (a, b, c, and d).
Fatigue looks to see if your maximum design stress-amplitudes fall within the borders (the red profile) of his diagram (Fig 5).
Fatigue only looks to see if your extreme stress ranges fall inside the Red zone and gives you an "ok" if it does or "fail" if it doesn't.
Fatigue compares tensile and shear stresses and also checks for strain energy compliance.
If "n/a" appears in the Output Data, the calculation falls outside the remit of this method.
You need to enter the following data for a result using this calculation method:
1) the six extreme principal stresses (Ṡ₁, Ṣ₁, Ṡ₂, Ṣ₂, Ṡ₃, Ṣ₃) that occur during the life of the component;
2) the yield stress (sỵ), ultimate tensile stress (su) and Young's modulus (E) for the material;
3) and the maximum possible stress range that gives an infinite fatigue life (δSṅ: Fig 1).
Fatigue will then tell you where each stress range (δS₁, δS₂, δS₃) falls relative to the diagram ("ok" or "fail").
Applicability
This calculator applies to structural metal in any form or shape under elastic stress only.
Further Reading
You will find further reading on this subject in reference publications(1 & 5)

