Brakes, Tyres and Cumulative Braking
(a mathematical study)
Brakes
The following is a mathematical study of cars' brakes and tyres since the 1930s. These calculations are not based upon factors (friction coefficients and hydraulic designs) assumed by CalQlata, they are based upon information collected from books and internet information.
However, given CalQlata's knowledge of rubber, tyrecord and friction coefficients, whilst we may not necessarily agree with the exact figures, we do agree with the comparative values.
CalQlata believes the following calculations to be a fully representative comparison of the subject matter over the time periods described.
Car Braking Systems
Prior to the widespread incorporation of hydraulic activation of drum brakes (1930s), vehicle braking systems were so ineffective and unpredictable that CalQlata considers the inclusion of pre-1930s cars to be difficult to include meaningfully in this report. Therefore, the earliest braking systems we have considered are the periods after the 1930s.
The Pedal
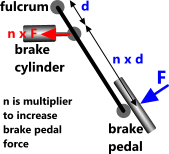
Fig 1. Brake Pedal
The force applied to a brake pedal in a modern car is multiplied by a factor of between 5 and 6 via a lever into the brake's master cylinder, meaning that if you apply a force of 25kgf to the brake pedal, the brake master cylinder will see about 140kgf (a typical method of achieving this is shown in Fig 1). Before the 1960s this multiplier was closer to 4 (n = 4).
Hydraulic System
The first hydraulic braking systems were put into vehicles in the 1920s. Within 10 years of Duesenburg's invention of the hydraulic brake system (1923), hydraulic brakes operated on all four wheels of all cars.
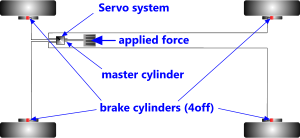
Fig 2. Drum Brake System
The system works by applying a force with your foot onto a pedal that forces hydraulic fluid into a master cylinder. Until around the mid-1960s, the hydraulic fluid worked on four hydraulic slave cylinders (one for each wheel) each of which forced friction pads onto the inside wall of a steel drum (Fig 2). All the hydraulic cylinders in the system were the same diameter and varied between 19mm (¾") and 25mm (1") in diameter dependent upon the performance and size of the vehicle.
This system meant that whatever force was applied to the brake master cylinder was applied equally to each wheel. Previous brake systems using cables and levers shared the applied force between each wheel, and not always equally.
Servo System
Servo (or booster) systems operated on vehicle braking systems from the early 1930's but it wasn't generally available until after the 2nd world war. The servo system uses a vacuum to increase the pressure applied to the hydraulic system. Because the servo's hydraulic cylinder was then (the 1930s) about 50% larger in diameter to that of the master cylinder, it more than doubled braking capacity {the vacuum increased this pressure by another >0.07MPa (10psi)}. Modern servo systems multiply the applied load (from the driver's foot) by a factor of three or four by way of larger cylinders and more efficient vacuum systems.
Disc Brakes
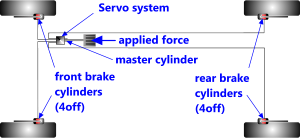
Fig 3. Disc Brake System
In the 1980s, almost all braking systems had changed to disc pads with similar cylinder sizes but two of them per wheel, one either side of the disc, doubling braking capacity (Fig 3). Over recent years 2 or more cylinders have been incorporated to each side of each disc assembly.
Because the front brakes on any car work harder than the rear brakes under heavy braking, greater capacity must be available at the front wheels than the back in order to prevent the rear wheels from locking up. Many high performance cars today either install larger cylinders or three of them (each side of the disc) at the front wheel and two cylinders at the rear.
Another significant recent improvement to disc brake performance is the increase in disc diameter (normally installed in front wheels) made possible due to a reduction in tyre profiles and an increase in wheel diameter, which houses the brake disc assembly.
Friction Coefficients
Friction coefficients are dependent upon the contact materials and independent of contact area. They are an important factor in braking system efficiency and have improved considerably over the years. Before the 1930s, brake materials ranged from wood (very early) to rubber and finally fabrics such as asbestos based linings, which appeared in the 1930s raising the friction coefficient and the ability to remain intact at high temperatures.
Early asbestos brake linings had a friction coefficient of around 0.25⁽¹⁾ but today's modern materials range between 0.35 for low-wear/low efficiency units and 0.62 for high-wear/high-efficiency pads⁽²⁾. For the purposes of this theoretical exercise, we shall assume that a decent car should have pads with a friction coefficient of about 0.4
Conclusions
To conclude (and ignoring wheel braking systems with wood or rubber blocks) the history of car braking system capacities may be summarised as follows, based upon a pedal force of 25kgf:
| Period | Multiplier | Coefficient | Brake Load | Comment |
|---|---|---|---|---|
| # | (μ) | kgf (≈N) | ||
| 1930 to 1950 | 4 x 4 | 0.25 | 100 (1000) | Drums; applied load to all four wheels |
| 1950 to 1960 | 5.5 x 8 | 0.3 | 330 (3300) | Servo; increases braking capacity |
| 1960 to 2000 | 5.5 x 16 | 0.35 | 770 (7700) | Discs; double braking capacity |
| 2000 to today | 5.5 x 20 | 0.4 | 1100 (11000) | Multiple brake cylinders on front wheels |
# multiplies are 'n' multiplied by number of brake cylinders + servo
Stopping Distances
A one tonne (1000kg) car travelling at 30mph (13.5m/s) will have the following kinetic energy:
Uᵢ = ½m.v² = 0.5 x 1000 x 13.5² = 91125N.m
Stopping distance d = Uᵢ ÷ F.μ + ½V (assumed reaction time of 0.5 seconds)
| Period | Brake Load | Stopping distance |
|---|---|---|
| (N) | m (ft) | |
| 1930 to 1950 | 1000 | 96.6 (317) |
| 1950 to 1960 | 3300 | 34 (111.4) |
| 1960 to 2000 | 7700 | 18.4 (60.3) |
| 2000 to today | 11000 | 14.9 (48.8) |
Stopping distances include reaction time
The above figures can be considered conservative and most well maintained cars of the period with quality braking systems should have achieved shorter braking distances. For example, today:
The stopping distance for a large, modern sports car weighing 1750kg with a high-performance braking system is provided in the table below. In the same table, the figures for a small city car, fitted with the same high-performance braking system, just for comparison purposes (small city cars are not provided with such braking systems today for reasons of cost).
Kinetic energy: Uᵢ = ½m.v²
Large sports car: Uᵢ = 0.5 x 1750 x 13.5² = 157377.75N.m
Small city car: Uᵢ = 0.5 x 930 x 13.5² = 83635.03N.m
| Vehicle | multiplier | Brake Pad | Brake Load | Stopping distance |
|---|---|---|---|---|
| (μ) | (N) | m (ft) | ||
| 2014 sports car | 6 x 25 | 0.6 | 37500 | 7 (23) |
| 2014 city car | 6 x 25 | 0.6 | 37500 | 3.7 (12.2) |
More than halving the braking distance of the heavier car with a conventional braking system and offering the potential to quarter the stopping distance of a small car...
... if only the tyres were also capable of stopping as quickly...
Tyres
Friction coefficients of the predominantly natural rubber used in tyres in the 1950s was around 0.35 in the wet and 0.8 in the dry. Today those coefficients have increased to 0.65 and >1.0⁽³⁾, today representing an 85% improvement in the wet and 30% improvement in the dry.
As mentioned above, friction coefficients are independent of contact area. So in theory it doesn't matter how many tyres are in contact with the road at the time of stopping, the weight of the car remains unchanged and will simply result in faster tyre wear. This isn't strictly true, however, as the efficiency of a tyre and therefore its ability to achieve its maximum friction coefficient is dependent upon contact area. So a wider, softer (modern rubbers and radial plies), larger wheel and all of them in equal contact with the road at the time of braking is more likely to result in maximum fictional resistance under braking than narrow, hard (old rubber and cross-plies), small wheels not all of which are in contact with the road.
So when we state friction coefficients for a tyre (wet and dry), they are based upon a high-efficiency system.
The stopping distance is again calculated using: d = Uᵢ ÷ F.μ, where F = the weight of the car on the road.
Assuming the above car (see Brakes) and its tyres achieve maximum efficiency under braking, i.e. a total mass of 1000kgf (10000N) of force between it and the road, we get:
| Period | Tyre Dry | Stopping Distance | Tyre Wet | Stopping Distance |
|---|---|---|---|---|
| (μ) | m (ft) | (μ) | m (ft) | |
| 1930 to 1950 | 0.8 | 11.4 (37.4) | 0.45 | 20.3 (66.4) |
| 1950 to 1960 | 0.9 | 10 (33.2) | 0.5 | 18 (59.8) |
| 1960 to 2000 | 1.0 | 9 (29.9) | 0.6 | 15 (49.8) |
| 2000 to today | 1.1 | 8.3 (27.2) | 0.65 | 14 (46) |
Stopping distances excluding reaction time
The reaction time for most normal people would be about 0.5 seconds, which at 30mph represents about 6.75m (22.14ft). Add this to the above stopping distances and we get the following:
| Period | Tyre Dry | Tyre Wet |
|---|---|---|
| m (ft) | m (ft) | |
| 1930 to 1950 | 18.14 (59.5) | 27 (88.6) |
| 1950 to 1960 | 16.9 (55.4) | 25 (81.94) |
| 1960 to 2000 | 15.8 (52) | 21.9 (72) |
| 2000 to today | 14.9 (48.8) | 20.8 (68.1) |
Stopping distances including reaction time
A tyre's frictional grip is different when skidding than when rolling. Therefore, it is essential to ensure that the wheels of a car do not lock up during braking, which is why many heavy cars and those with high-performance braking systems today use limited-slip differentials (LSD).
Tyres & Brakes Together
The following Table compares stopping distances for tyres and brakes under normal conditions.
| Period | Brakes | Tyre Dry | Tyre Wet |
|---|---|---|---|
| m (ft) | m (ft) | m (ft) | |
| 1930 to 1950 | 96.6 (317) | 18.14 (59.5) | 27 (88.6) |
| 1950 to 1960 | 34 (111.4) | 16.9 (55.4) | 25 (81.94) |
| 1960 to 2000 | 18.4 (60.3) | 15.8 (52) | 21.9 (72) |
| 2000 to today | 14.9 (48.8) | 14.9 (48.8) | 20.5 (67.4) |
As you can see, until today, brakes have had a lower capacity for emergency stopping than the tyres, whereas today, braking and tyre capacities are much more evenly matched.
Applying today's technology to other speeds ...
| Speed | Brakes | Tyre Dry | Tyre Wet | UK Gov't (dry) |
|---|---|---|---|---|
| (mph) | m (ft) | m (ft) | m (ft) | m (ft) |
| 30 | 14.9 (48.8) | 14.9 (48.8) | 20.5 (67.4) | 23 (75) |
| 40 | 23.5 (77) | 23.5 (77) | 33.5 (110) | 36 (118) |
| 50 | 33.9 (111.2) | 33.9 (111.2) | 49.6 (162.8) | 53 (175) |
| 60 | 46.1 (151.3) | 46.1 (151.3) | 68.8 (225.6) | 73 (240) |
| 70 | 60.2 (197.4) | 60.2 (197.4) | 91 (298.5) | 96 (315) |
| 80 | 76 (249.4) | 76 (249.4) | 116.3 (381.4) | n/a |
| 90 | 93.7 (307.4) | 93.7 (307.4) | 144.6 (474.5) | n/a |
| 100 | 113.2 (371.4) | 113.2 (371.4) | 176.1 (577.7) | n/a |
| 110 | 134.5 (441.3) | 134.5 (441.3) | 210.6 (690.6) | n/a |
| 120 | 157.6 (517.2) | 157.6 (517.2) | 248.2 (814.3) | n/a |
Stopping distances including reaction time
Excluding the distance covered due to reaction, the above deceleration (a = [V² - U²] ÷ 2.d) is 11m/s² (1.22g), which means that a good quality modern car with equipment working properly, should decelerate under hard emergency braking (25kgf on the brake pedal) at more than 1g (in the dry) and the car should not skid. Moreover, it would be reasonable to assume that many of today's high-performance cars with the best quality tyres and brakes should stop in distances considerably shorter than the above⁽⁴⁾, especially given the larger discs available today.
Whilst it would be reasonable to apply an efficiency loss of about 10% to all of the above figures, it is also reasonable to assume that most manufacturers are installing better than basic systems in their cars today, so a performance improvement of 10% would be equally valid.
As such, CalQlata believes that the above table is a reasonable summary of stopping distances for most properly maintained cars in 2014, and that the UK government figures are more representative of cars in the 1950's⁽⁵⁾.
This also shows that the manufacturers of tyres, cars and their braking systems are doing an excellent job.
Cumulative Braking
The following calculations show what happens when a number of cars, one behind the other, encounter a speed restriction.
These calculations have been performed for 5 cars (A to E) following each other at a distance considered to be a comfortable minimum separation (CMS). When the separation between any two cars falls below the CMS, the following car will continue to decelerate until the CMS is regained, at which point the following car will accelerate to the restricted speed (Fig 4).
Typical Calculation:
A leading car (Car A), travelling at 60mph (30m/s) arrives at speed restriction of 40mph (20m/s) and brakes to bring the car's speed down to the restricted speed. Each following car (B to E) reacts within half a second and decelerates at the same rate.
The following parameters are assumed:
CMS: The same CMS is assumed before and after the speed restriction⁽⁶⁾
reaction time: tᵣ = 0.5s
initial velocity: U = 30m/s
final velocity: V = 20m/s
acceleration & deceleration: a = ±2.86m/s² (6.5kgf on the brake pedal)
The Cars
The 'Datum' is the point at which Car A crosses the speed restriction
Car A
Time taken to reach final velocity and distance covered at final velocity
t² = (V - U)/a = (30-20) / -2.86 = 3.5s
Total distance covered during 3.5 second period
d² = Ut + ½at² = 30x3.5 + -2.86x3.5²/2 = 87.483m
Car B
distance covered during reaction time
dᵇ₁ = Ut = 30x0.5 = 15m
distance travelled during remaining 3 seconds (from the Datum)
dᵇ₂ = Ut + ½at² = 30x3.0 + -2.86x3.0²/2 = 77.13
Total distance covered during 3.5 second period
dᵇ = dᵇ₁ + dᵇ₂ = 15 + 77.13 = 92.13m
Car C
distance covered during reaction time
dᶜ₁ = Ut = 30x0.5 = 15m
distance travelled during remaining 2.5 seconds (from the Datum)
dᶜ₂ = Ut + ½at² = 30x2.5 + -2.86x2.5²/2 = 66.063
Total distance covered during 3.5 second period
dᶜ = dᵇ₁ + dᶜ₁ + dᶜ₂ = 15 + 15 + 66.063 = 96.063m
Car D
distance covered during reaction time
dᵈ₁ = Ut = 30x0.5 = 15m
distance travelled during remaining 2.0 seconds (from the Datum)
dᵈ₂ = Ut + ½at² = 30x2.0 + -2.86x2.0²/2 = 54.28
Total distance covered during 3.5 second period
dᵈ = dᵇ₁ + dᶜ₁ + dᵈ₁ + dᵈ₂ = 15 +15 + 15 + 54.28 = 99.28m
Car E
distance covered during reaction time
dᵉ₁ = Ut = 30x0.5 = 15m
distance travelled during remaining 1.5 seconds (from the Datum)
dᵉ₂ = Ut + ½at² = 30x1.5 + -2.86x1.5²/2 = 41.783
Total distance covered during 3.5 second period
dᵉ = dᵇ₁ + dᶜ₁ + dᵈ₁ + dᵉ₁ + dᵉ₂ = 15 +15 +15 + 15 + 41.783 = 101.78m
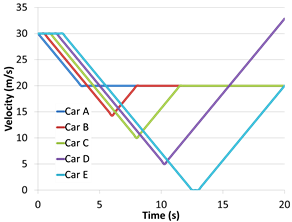
Fig 4. Speed vs Time
The detailed calculations carried out to establish the pattern of behaviour for all five cars are too extensive to include here but have been summarised graphically in Figs 4 to 6.
Fig 4 shows the speed of each car whilst trying to maintain CMS. The graph clearly shows Car E coming to a halt 12.5 seconds after Car A first begins to decelerate.
Fig 5 shows the distance each car covers from the time Car A first begins to decelerate. As can be seen in the graph, the distance travelled is rapidly reducing.
Fig 6 shows the spacing between each following pair of cars. As can be seen from the graph the spacing becomes exaggerated whilst trying to maintain CMS
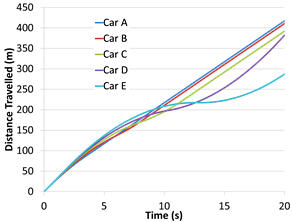
Fig 5. Distance vs Time
It doesn't matter how the assumptions are altered:
CMS: could be decreased with speed#,
reaction time: could be reduced, and/or
acceleration & deceleration could be increased##
... our internal calculations show that the only difference to the outcome is the number of cars it would take to bring the traffic to a halt#, fuel consumption## and the potential for an accident if a car in the traffic had less than perfect brakes and/or tyres. The greatest improvement we could achieve during the above speed restriction is traffic becoming stationary after almost 100 cars, assuming emergency braking conditions, similarly hard acceleration and a reaction time of 0.2 seconds.
The above calculations are based upon reasonable but sufficiently slow operational times for reasons of clarity (i.e. in which traffic is brought to a halt with just 5 cars).
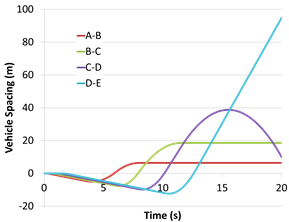
Fig 6. Spacing vs Time
The only way in which to avoid accumulative braking is if every single car simultaneously applies its brake when the leading car reaches a speed restricted area, decelerates at exactly the same rate and settles down at the same restricted speed, which of course is a physical impossibility. Even modern automatic braking systems need a reaction time that is necessary to establish a change in speed in a leading vehicle, and the expected approach to safety will mean that vehicle reactions will be exaggerated causing accumulated braking to occur all the more rapidly.
This is the reason why heavy road traffic invariably comes to a halt under variable speed control and when entering speed restricted road works.
Notes
- Google Books: Automotive Brake Systems Page 160
- Specialist brake pad suppliers: VWVortex and Camskill
- Technical review of tyres (Google Books-removed)
- Stopping distances in 2014
- Stopping distances that reflect 1945 (https://www.rac.co.uk/drive/advice/learning-to-drive/stopping-distances/)
- Reducing the CMS in line with reduced speed will result in the same overall outcome albeit more vehicles will be required to bring the traffic to a halt.